How to make BI work for your business
In our previous blog – The Power of Business Intelligence – we looked at how savvy companies are harnessing the power of BI to grow and streamline their businesses.
But to achieve anything close to success, Business Intelligence and the gathering of data need to be implemented wisely.
This means careful planning, targeted investment and a good dose of initiative.
Firstly, managers need to make sure their objectives are clear. There has to be a very strong awareness of the business decisions that need to be made, and exactly what data you require to make them.
For example, perhaps you want to increase sales in a key market. In this case, you need historic data on performance indicators in that market, along with data from other markets that point towards success.
You can then use BI to aggregate past data and analyse new data when it comes in. This allows you to measure how close you are to achieving your goals.
Once you have a solid strategy in place, you need to think about how you will collect your data. If some of it already exists but in different formats – on Excel spreadsheets, for instance, or even on old-fashioned paper – then you need to make use of the Data Warehouse to standardise it all.
New data should be collected in the most efficient way possible. The latest technology – such as the telematics systems used by transport companies to streamline deliveries – helps you collect digital data in real time and feeds it straight into your BI software.
You might also use people in the field to gather data for you, but having everything collected digitally will make a huge difference to accuracy and the speed it can be analysed.
Configuring your data to be accessible across a range of departments with appropriate controls is called ‘data governance’, and is an intrinsic component of Business Intelligence software. Not only does it protect privacy, it also filters out unnecessary data, streamlining the whole data visualisation process.
In plain sight

Data visualisation is basically tech speak for ‘presentation’, and is crucial to the success of BI.
So how do you make sure that your carefully collected data is presented in such a way that people will actually use it?
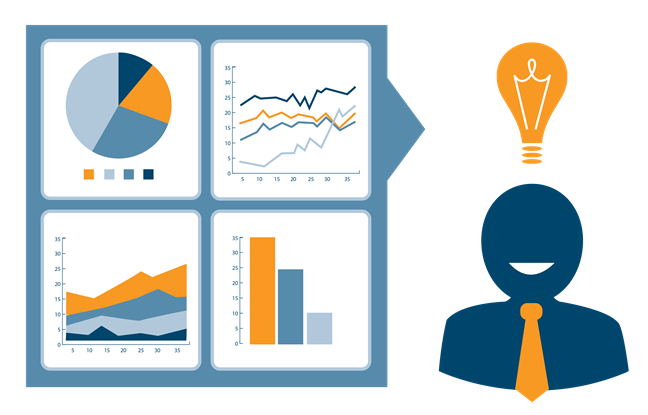
Enter the humble dashboard; the key to making sure data gets used productively. Inspired by the simple control deck of a vehicle, the BI dashboard can be configured to present essential information in the most accessible and stimulating way.
There’s usually very little text. Instead, data is presented in the form of graphs, infographics or diagrams, making data analysis quick and simple. This improves usability, so the user finds it more appealing.
Importantly, dashboards can be configured for different purposes. The accounting department, for example, can look at raw profit and loss statistics, while management might see a snapshot of the most significant KPIs.
Creative data visualisation allows users to take in vital information, without having to wade through countless sheets of Excel or 50 pages of a report simply to access fairly simple data.
John Ryan is Product Marketing Director at Yellowfin – an award-winning BI software company, for which Aware Corporation is the sole distributor in Thailand.
According to Ryan, there are seven qualities that make a dashboard accessible and beneficial:
· Designed for a specific purpose – takes into account factors such as audience, data needed and how often it is accessed
· Summarises – displays only important metrics, starting at a high level with the ability to drill down
· Effective layout – sets out most important information in appropriate order
· Clarity – easy to understand with clear description of key variables
· Draws attention – effectively signposted using annotations, with consistent signals and symbols applied to metrics
· Interactive – engaging, and links to different parts of the report with a click
· Sharable – easy to share with others across the organisation to increase value
The route to success
If you are seriously considering using Business Intelligence, but baulking at the prospect of sourcing decent software as well as creating the right infrastructure to use it, then you need to hire a good software company.
They will walk you through selecting the right level of software, and help you configure it so that it works effectively for your business.
In the early days, there will be a lot of trial and error as you get used to your BI software, enjoying its many benefits as well as learning to work within its limitations.
Ultimately, though, you can be sure that your business, and the way it is managed, will be forever changed.
And you’ll be right there ahead of your competitors, using data to make solid business decisions to drive your company to success.
Speak to our expert team and find out how BI can help grow your business.
Aware Corporation Ltd work with Yellowfin to deliver a Business Intelligence solution tailored for the specific needs of your business.
Video: Tips on how to get the most out of you Business Intelligence dashboards, from our partner, Yellowfin